Creates a violin plot to compare gene expression across different conditions or groups within a Seurat object. It incorporates different tests to evaluate statistical differences between conditions. The plot can be customized with options for data transformation, jitter display, and significance annotations. The function also supports multiple conditions and allows for visualisation of statistical results from different test.
Usage
DO.VlnPlot(
  sce_object,
  Feature,
  ListTest = NULL,
  returnValues = FALSE,
  ctrl.condition = NULL,
  group.by = "condition",
  group.by.2 = NULL,
  geom_jitter_args = c(0.2, 0.25, 0.25),
  geom_jitter_args_group_by2 = c(0.1, 0.1, 1),
  vector_colors = c("#1f77b4", "#ea7e1eff", "royalblue4", "tomato2", "darkgoldenrod",
    "palegreen4", "maroon", "thistle3"),
  test_use = "wilcox",
  correction_method = "fdr",
  p_values = NULL,
  y_title = "log(nUMI)",
  stat_pos_mod = 1.15,
  hjust_test = 0.8,
  vjust_test = 2,
  size_test = 3.33,
  step_mod = 0,
  hjust_test_2 = 0.5,
  vjust_test_2 = 0,
  sign_bar = 0.8,
  random_seed = 42
)
Arguments
- sce_object
combined SCE object or Seurat
- Feature
name of the feature
- ListTest
List for which conditions wilcox will be performed, if NULL always CTRL group against everything
- returnValues
return df.melt.sum data frame containing means and SEM for the set group
- ctrl.condition
set your ctrl condition, relevant if running with empty comparison List
- group.by
select the seurat sce_object slot where your conditions can be found, default conditon
- group.by.2
relevant for multiple group testing, e.g. for each cell type the test between each of them in two conditions provided
- geom_jitter_args
vector for dots visualisation in vlnplot: size, width, alpha value
- geom_jitter_args_group_by2
controls the jittering of points if group.by.2 is specified
- vector_colors
specify a minimum number of colours as you have entries in your condition, default 2
- test_use
perform one of c( "wilcox", "wilcox_limma", "bimod", "t", "negbinom", "poisson", "LR", "MAST", "DESeq2", "none" ). default "wilcox"
- correction_method
correction for p-value calculation. One of c("BH", "bonferroni", "holm", "BY", "fdr", "none"). default "fdr"
- p_values
Manually providing p-values for plotting, be aware of group size and if necessary make your test return the same amount of values
- y_title
specify title on the y axis. default "log(nUMI)"
- stat_pos_mod
value for modifiyng statistics height
- hjust_test
value for adjusting height of the text
- vjust_test
value for vertical of text
- size_test
value for size of text of statistical test
- step_mod
value for defining the space between one test and the next one
- hjust_test_2
value for adjusting height of the text, with group.by.2 specified
- vjust_test_2
value for vertical of text, with group.by.2 specified
- sign_bar
adjusts the sign_bar with group.by.2 specified
- random_seed
parameter for random state initialisation
Examples
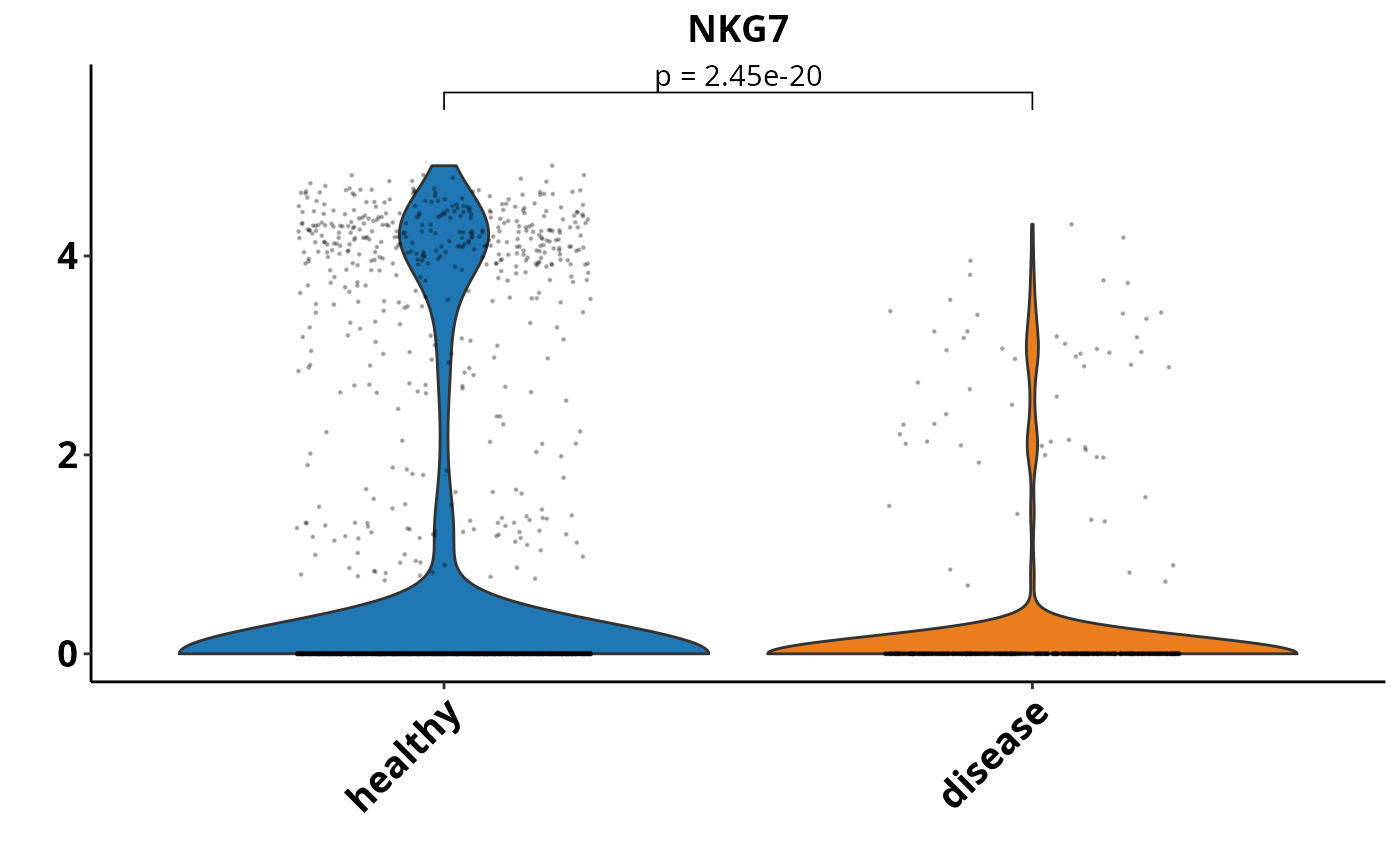
sce_data <-
    readRDS(system.file("extdata", "sce_data.rds", package = "DOtools"))

ListTest <- list()
ListTest[[1]] <- c("healthy", "disease")

DO.VlnPlot(
    sce_object = sce_data,
    Feature = "NKG7",
    ListTest = ListTest,
    ctrl.condition = "healthy",
    group.by = "condition"
)
#> Using condition, orig.ident as id variables