Creates a polished UMAP plot using Seurat's DimPlot or FeaturePlot functions. In addition a density plot can be made in a similar way to nebulosa R package. It allows customization of colors, labels, and other plot elements for better visualisation. The function handles both cluster-based visualisations and gene-based visualisations in a UMAP plot. Ideal for refining UMAP outputs with added flexibility and enhanced presentation.
Arguments
- sce_object
The seurat or SCE object
- features
features for Featureplot
- group.by
grouping of plot in DImplot and defines in featureplot the labels
- FeaturePlot
Is it going to be a FeaturePlot?
- DensityPlot
Is it going to be a DensityPlot?
- reduction
reduction to use
- dims
Dimensions to plot, must be a two-length numeric vector specifying x- and y-dimensions description
- layer
Layer to use for DensityPlot, default data
- umap_colors
what colors to use for UMAP, specify as vector
- text_size
Size of text
- label
label the clusters on the plot by group.by column
- order
Boolean determining whether to plot cells in order of expression.
- plot.title
title for UMAP
- legend.position
specify legend position
- method
Kernel density estimation method, can be "ks" or "wkde"
- ...
Further arguments passed to DimPlot, FeaturePlot or DensityPlot functions
Examples
sce_data <-
readRDS(system.file("extdata", "sce_data.rds", package = "DOtools"))
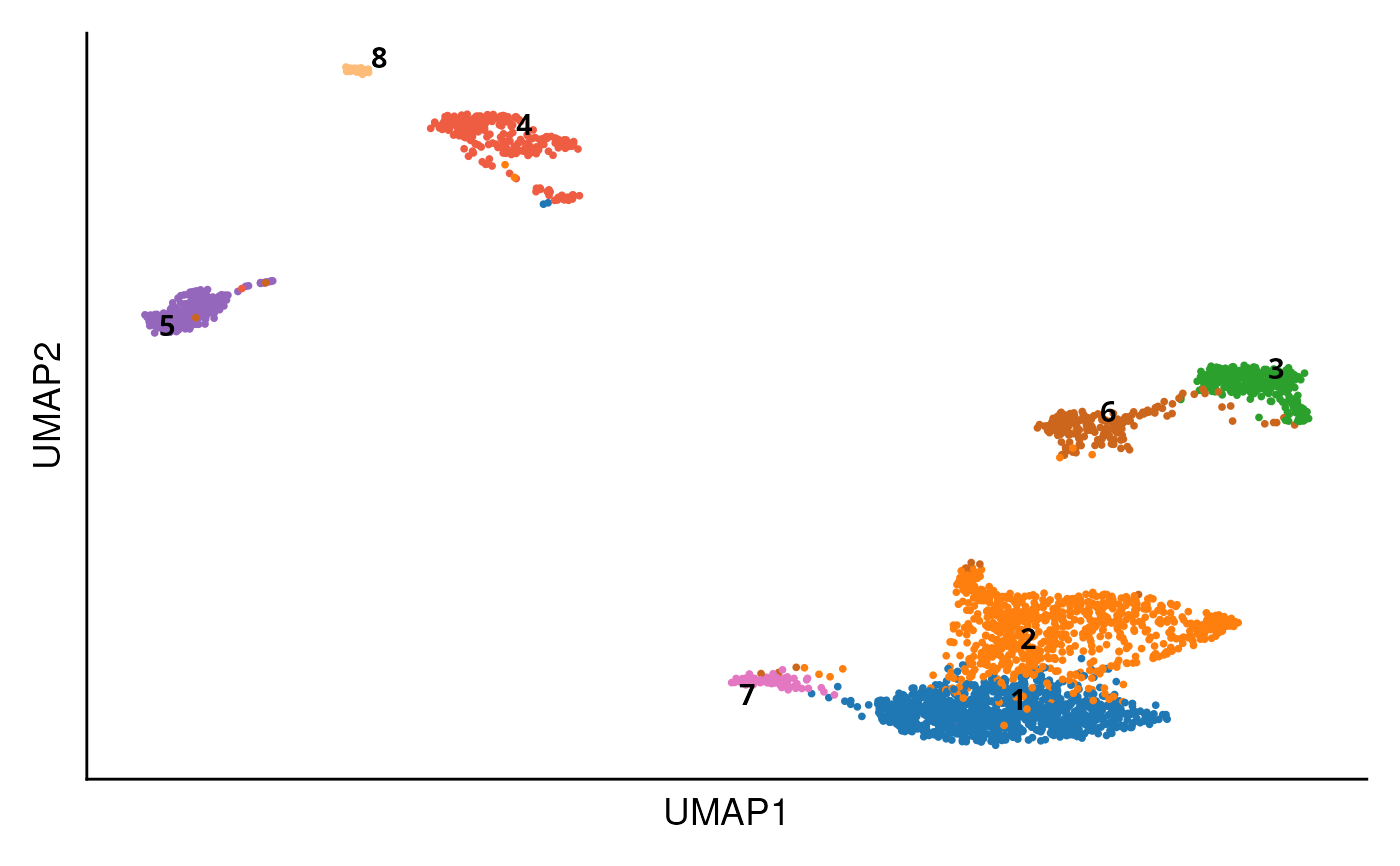
DO.UMAP(
sce_object = sce_data,
group.by = "seurat_clusters"
)
 DO.UMAP(
sce_object = sce_data,
FeaturePlot = TRUE,
features = c("BAG2", "CD74")
)
#> Warning: The following requested variables were not found: BAG2
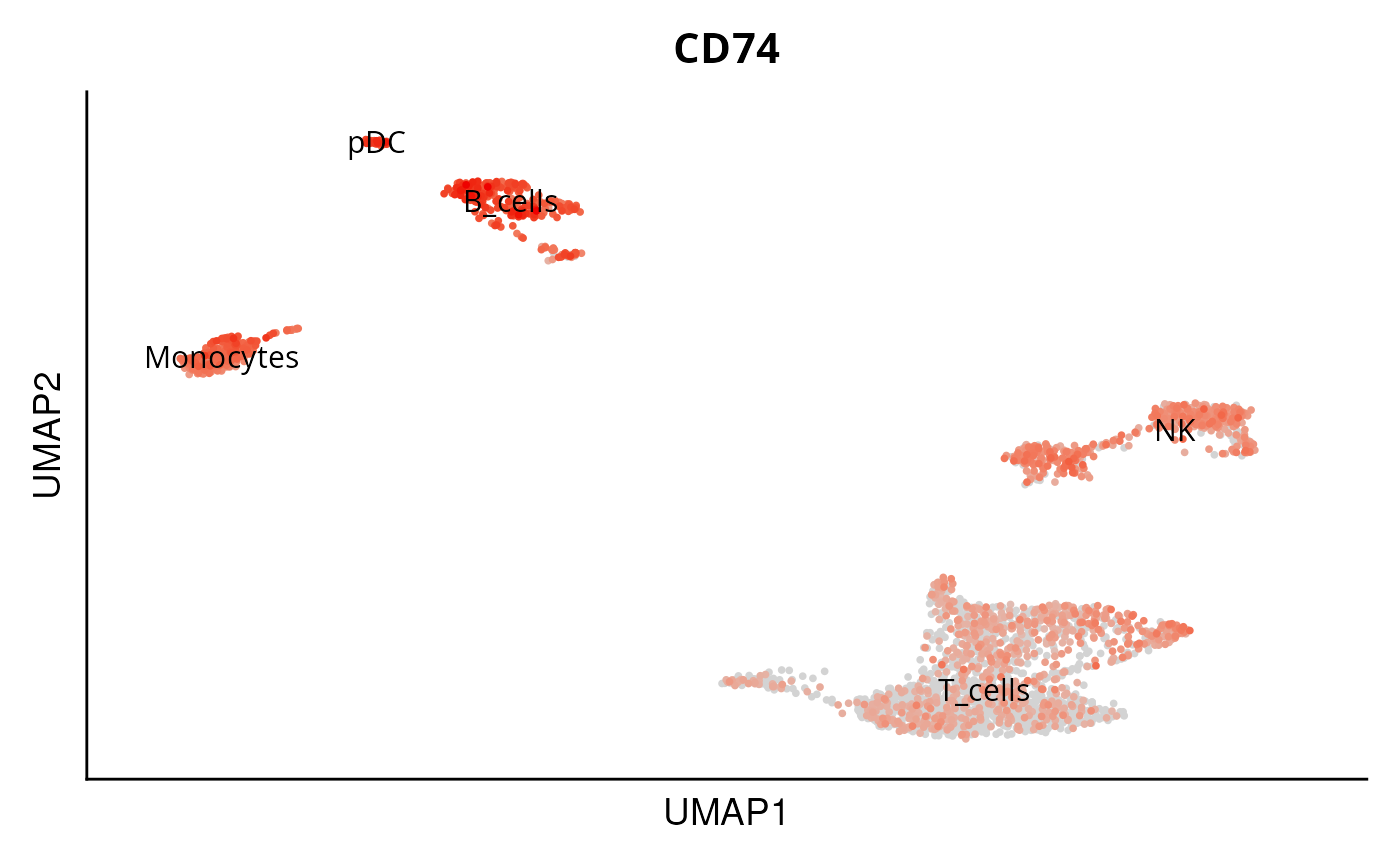
DO.UMAP(
sce_object = sce_data,
FeaturePlot = TRUE,
features = c("BAG2", "CD74")
)
#> Warning: The following requested variables were not found: BAG2
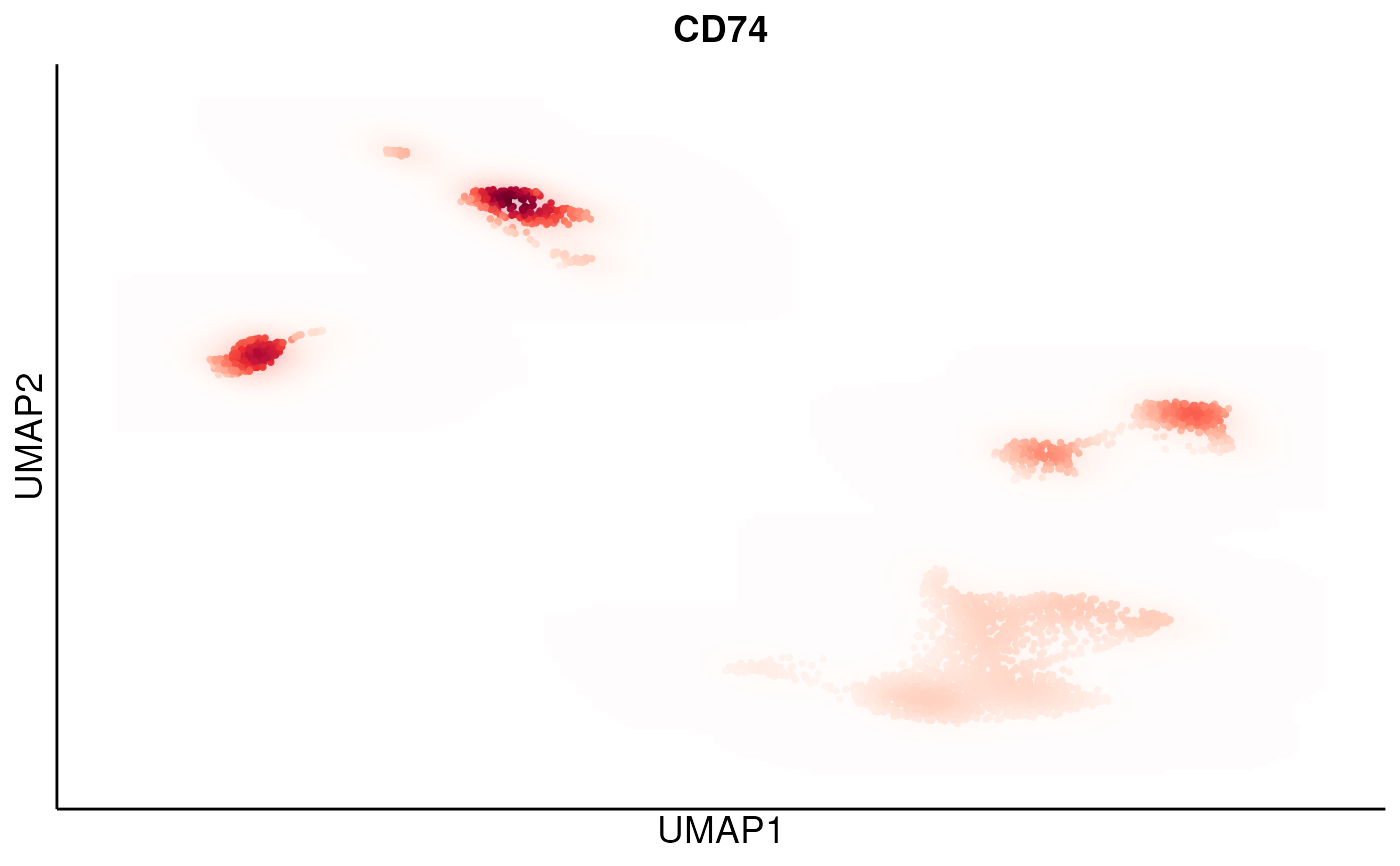
 DO.UMAP(
sce_object = sce_data,
DensityPlot = TRUE,
features = c("CD74")
)
#> Warning: Removed 11400 rows containing non-finite outside the scale range
#> (`stat_contour_filled()`).
DO.UMAP(
sce_object = sce_data,
DensityPlot = TRUE,
features = c("CD74")
)
#> Warning: Removed 11400 rows containing non-finite outside the scale range
#> (`stat_contour_filled()`).