This function generates a dot plot for multiple genes, comparing expression levels across one or two specified groups. It supports both individual and pseudobulk expression calculations. Highly variable customization options allow control over dot size, color scaling, annotations, and axis orientation. The function integrates seamlessly with SCE objects for single-cell RNA-seq analysis.
Usage
DO.Dotplot(
  sce_object,
  Feature,
  group.by.x = NULL,
  group.by.y = NULL,
  group.by.y2 = NULL,
  across.group.by.x = FALSE,
  across.group.by.y = FALSE,
  sort_x = NULL,
  sort_y = NULL,
  dot.size = c(1, 6),
  plot.margin = c(1, 1, 1, 1),
  midpoint = 0.5,
  scale_gene = FALSE,
  returnValue = FALSE,
  log1p_nUMI = TRUE,
  hide_zero = TRUE,
  annotation_x = FALSE,
  annotation_x_position = 0.25,
  annotation_x_rev = FALSE,
  point_stroke = 0.2,
  limits_colorscale = NULL,
  coord_flip = FALSE,
  stats_x = FALSE,
  stats_y = TRUE,
  sig_size = 6,
  nudge_x = 0.3,
  nudge_y = 0.2,
  ...
)
Arguments
- sce_object
The SCE object or Seurat
- Feature
Genes or DF of interest, Data frame should have columns with gene and annotation information, e.g. output of FindAllMarkers
- group.by.x
group name to plot on x-axis
- group.by.y
group name to look for in meta data
- group.by.y2
second group name to look for in meta data
- across.group.by.x
calculate a pseudobulk expression approach for the x-axis categories
- across.group.by.y
calculate a pseudobulk expression approach for the y-axis categories
- sort_x
Vector sorting the xaxis
- sort_y
Vector to sort the yaxis
- dot.size
Vector of dot size
- plot.margin
= plot margins
- midpoint
midpoint in color gradient
- scale_gene
If True calculates the Z-score of the average expression per gene
- returnValue
return the dataframe behind the plot
- log1p_nUMI
log1p the plotted values, boolean
- hide_zero
Removes dots for genes with 0 expression
- annotation_x
Adds annotation on top of x axis instead on y axis
- annotation_x_position
specifies the position for the annotation
- annotation_x_rev
reverses the annotations label order
- point_stroke
Defines the thickness of the black stroke on the dots
- limits_colorscale
Set manually colorscale limits
- coord_flip
flips the coordinates of the plot with each other
- stats_x
Perform statistical test over categories on the xaxis
- stats_y
Perform statistical test over categories on the yaxis
- sig_size
Control the size of the significance stars in the plot
- nudge_x
Control the position of the star on x axis
- nudge_y
Control the position of the star on y axis
- ...
Further arguments passed to annoSegment function if annotation_x == TRUE
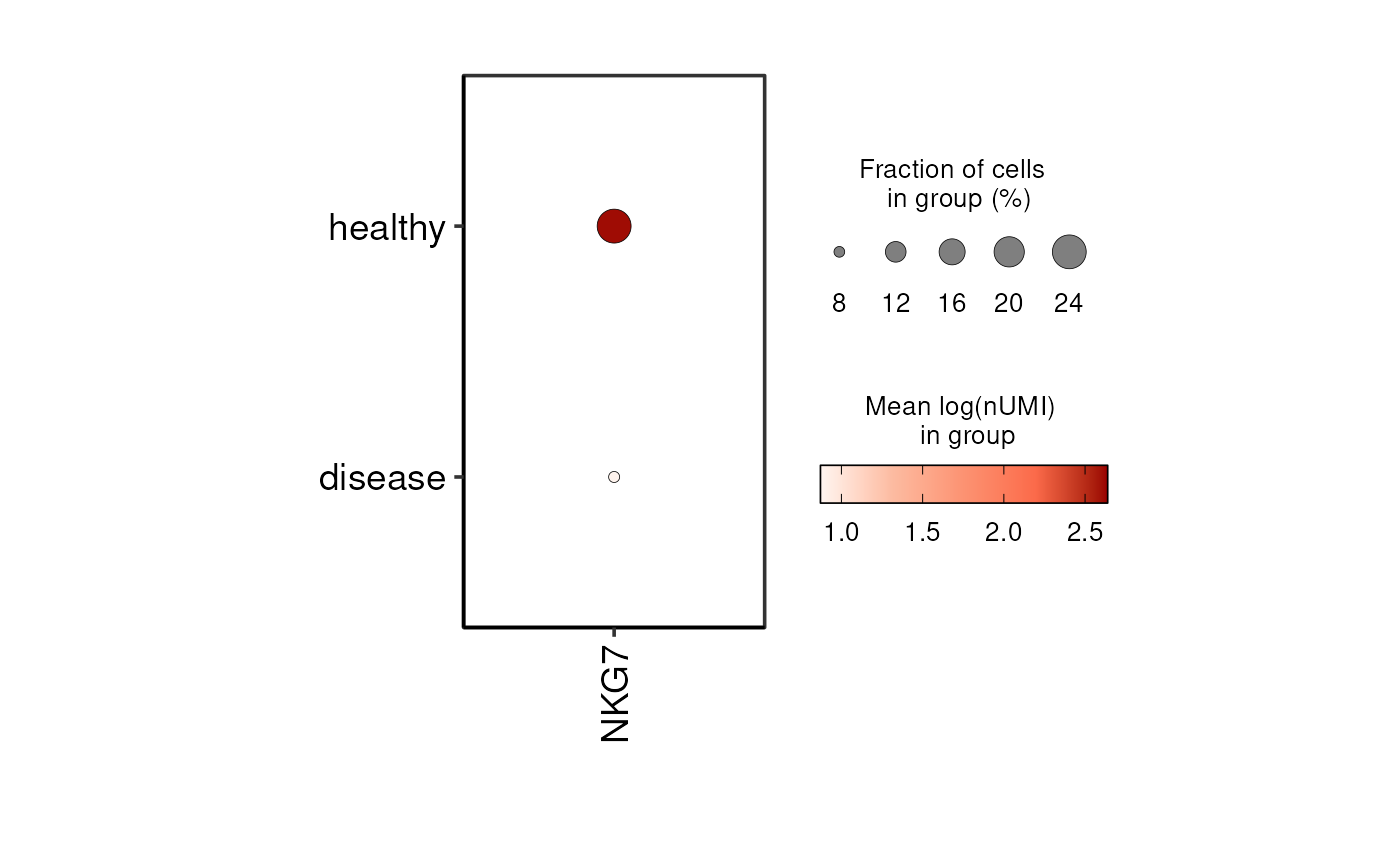
Examples
sce_data <-
    readRDS(system.file("extdata", "sce_data.rds", package = "DOtools"))

DO.Dotplot(
    sce_object = sce_data,
    Feature = c("NKG7", "IL6", "MALAT1"),
    group.by.x = "condition"
)
#> Warning: The following requested variables were not found: IL6, MALAT1
#> Scale for size is already present.
#> Adding another scale for size, which will replace the existing scale.