Perform SEM-based graphs with Wilcox test on single-cell level for Seurat and SCE objects. Calculates mean expression values and SEM for the selected feature, and visualizes them. Performs pairwise Wilcox tests comparing conditions, with optional custom control condition and clustering. Optionally returns a summary data frame, statistical test results, and the generated plot.
Usage
DO.BarplotWilcox(
  sce_object,
  Feature,
  ListTest = NULL,
  returnValues = FALSE,
  ctrl.condition = NULL,
  group.by = "condition",
  wilcox_test = TRUE,
  bar_colours = NULL,
  stat_pos_mod = 1.15,
  step_mod = 0.2,
  x_label_rotation = 45,
  plotPvalue = FALSE,
  y_limits = NULL,
  log1p_nUMI = TRUE
)
Arguments
- sce_object
combined SCE object or Seurat
- Feature
name of the feature/gene
- ListTest
List for which conditions wilcoxon test will be performed, if NULL always CTRL group against everything
- returnValues
return data frames needed for the plot, containing df.melt, df.melt.sum, df.melt.orig and wilcoxstats
- ctrl.condition
set your ctrl condition, relevant if running with empty comparison List
- group.by
select the seurat object slot where your conditions can be found, default conditon
- wilcox_test
perform wilcox test. boolean default TRUE
- bar_colours
colour vector
- stat_pos_mod
Defines the distance to the graphs of the statistic
- step_mod
Defines the distance between each statistics bracket
- x_label_rotation
Rotation of x-labels
- plotPvalue
plot the non adjusted p-value without correcting for multiple tests
- y_limits
set limits for y-axis
- log1p_nUMI
If nUMIs should be log1p transformed
Examples
sce_data <-
readRDS(system.file("extdata", "sce_data.rds", package = "DOtools"))
ListTest <- list()
ListTest[[1]] <- c("healthy", "disease")
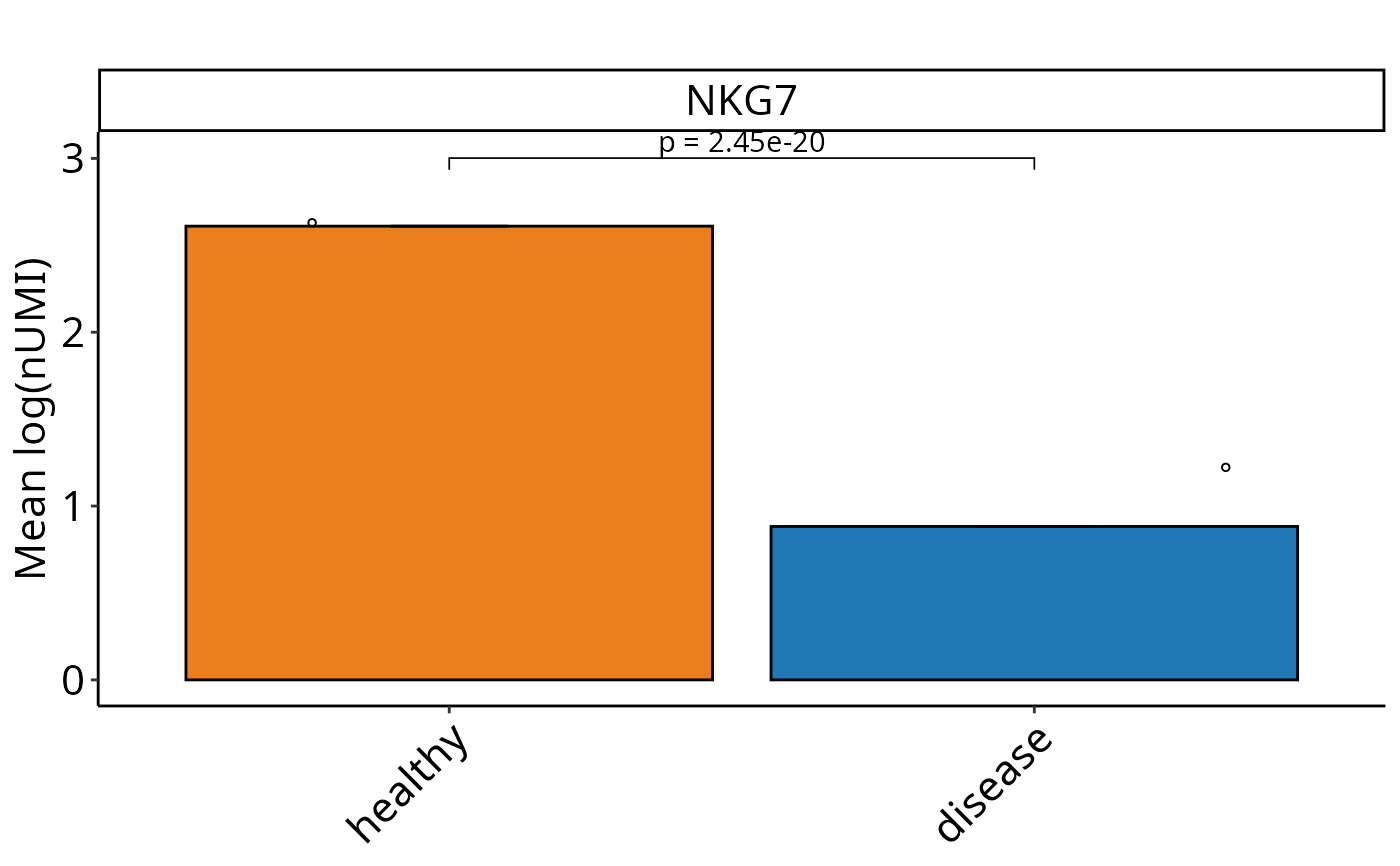
DO.BarplotWilcox(
sce_object = sce_data,
Feature = "NKG7",
ListTest = ListTest,
ctrl.condition = "healthy",
group.by = "condition"
)
#> Using condition, orig.ident as id variables