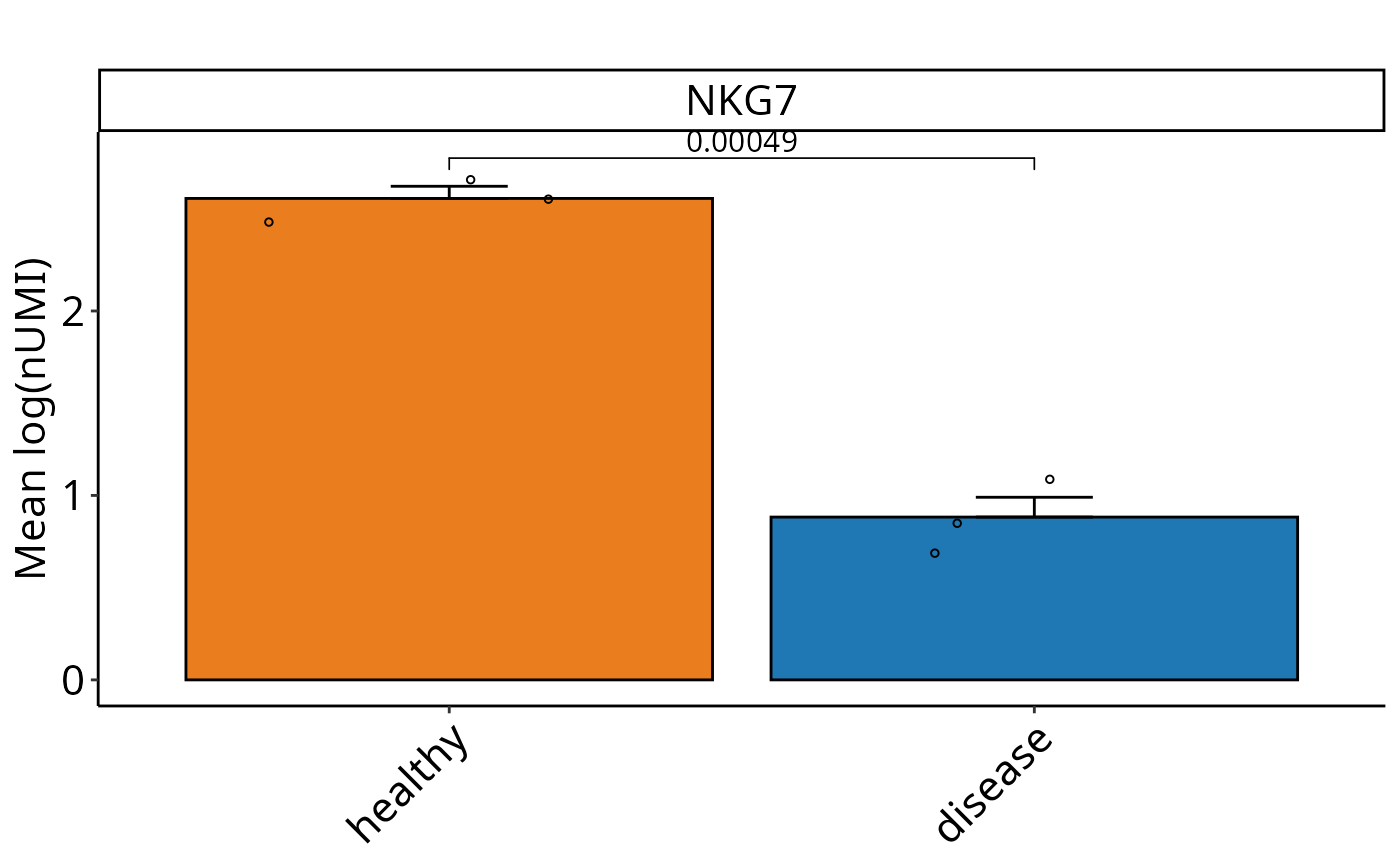
Perform SEM-based graphs with t-test on cluster level for SCE objects. Calculates mean expression values and SEM for selected features and visualizes them. Performs pairwise t-tests comparing conditions, with optional custom control condition and clustering. Optionally returns a summary data frame.
Usage
DO.BarplotClustert(
  sce_object,
  Feature,
  ListTest = NULL,
  returnValues = FALSE,
  ctrl.condition = NULL,
  group.by = "condition",
  returnPlot = TRUE,
  bar_colours = NULL,
  stat_pos_mod = 1.15,
  step_mod = 0.2,
  x_label_rotation = 45,
  y_limits = NULL,
  log1p_nUMI = TRUE,
  random_seed = 42
)
Arguments
- sce_object
Combined SCE object or Seurat
- Feature
gene name
- ListTest
List with conditions t-test will be performed, if NULL always against provided CTRL
- returnValues
return df.melt.sum data frame containing means and SEM for the set group
- ctrl.condition
set your ctrl condition, relevant if running with empty comparison List
- group.by
select the seurat object slot where your conditions can be found, default conditon
- returnPlot
IF TRUE returns ggplot
- bar_colours
colour vector
- stat_pos_mod
Defines the distance to the graphs of the statistic
- step_mod
Defines the distance between each statistics bracket
- x_label_rotation
Rotation of x-labels
- y_limits
set limits for y-axis
- log1p_nUMI
If nUMIs should be log1p transformed
- random_seed
parameter for random state initialisation
Examples
sce_data <-
    readRDS(system.file("extdata", "sce_data.rds", package = "DOtools"))

set.seed(123)
sce_data$orig.ident <-
    sample(rep(c("A", "B", "C"), length.out = ncol(sce_data)))

ListTest <- list()
ListTest[[1]] <- c("healthy", "disease")


DO.BarplotClustert(
    sce_object = sce_data,
    Feature = "NKG7",
    ListTest = ListTest,
    ctrl.condition = "healthy",
    group.by = "condition"
)
#> Using condition, orig.ident as id variables